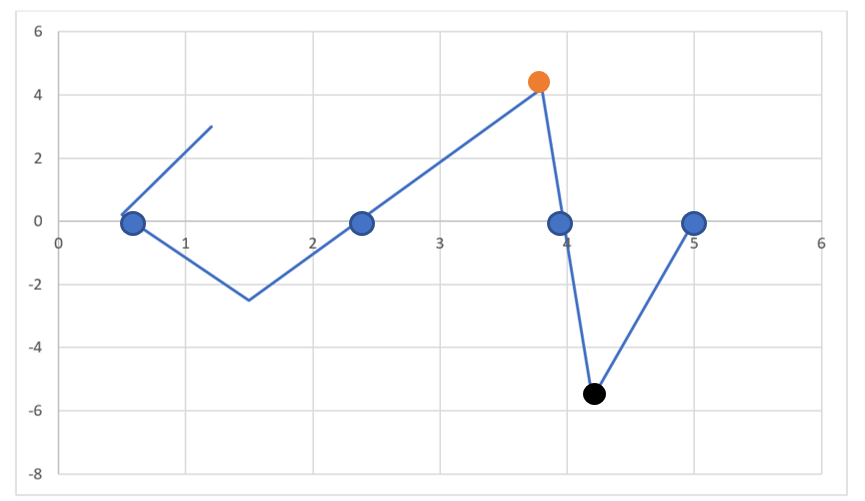
Observe the graph above.
Let’s say that the graph above is of some equation “p”. Let’s pen down what all can we evaluate just by looking at the graph.
First thing I would say, just by looking at it is that it’s a line graph formed by connecting certain number of points. Some of the points according to my first observations are (0.7,0.1), (1.2,3), (5,0), and so on.
Second thing I would realize from this graph is that it has a maximum value of 4.1 at x=3.7 (indicated with orange dot) and it has minimum value of -5.8 at x=4.2 (indicated with black dot).
Third thing I would realize is that the graph has four roots/zeroes/solution, since it is intersecting the x-axis at four different points (indicated with blue dots).
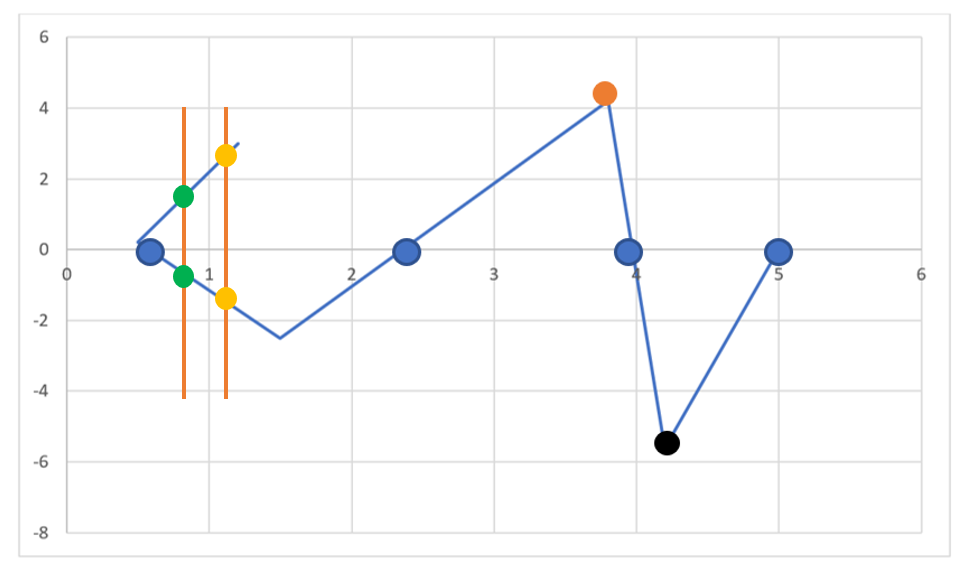
Now, one may wonder why didn’t I use the word function while describing the graph above. Right!!!
It’s because of the fact that for one input value / value of x, the graph has two or more y values, which in short is also known as vertical line test.
So, what is a vertical line test. Let’s understand that with the help of the graph.
Observe the two vertical lines drawn in orange color, the two vertical lines are intersecting the graph at two different points shown with green color dots and yellow color dots. This is known as vertical line test.
Yes!! You simply have to draw the vertical lines and ensure no vertical line is intersecting the graph at two or more points.
If it does then it isn’t a function.
These all have to be your observations whenever you see a graph.
Now let’s have another graph and analyze it!!
Let’s go through the conversation between Harshit and Athrav!!
Harshit: Now, I believe the first thing you’ll observe is that the graph passed the vertical line test.
Athrav: Oh really!! What if I draw infinite non overlapping lines vertical lines? Let’s see how that’s going to work. Huhh!!
Harshit: You can do that or better try imagining infinite non overlapping vertical lines. Do you think they would intersect the graph at more than a point?
Athrav: Umm.. Not really. I guess you are right. Oh!! Now I get it. This is a graph for some function.
Harshit: Yep.
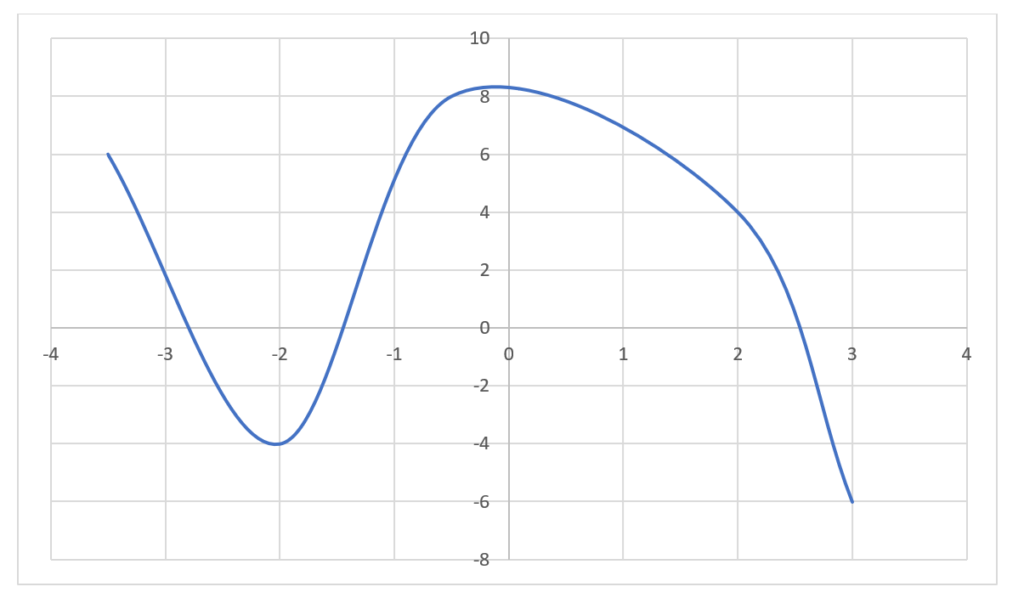
Delving more into functions
Let’s say that the graph above is for some function f(x).
Moving on we also need to know what is y-intercept and how to calculate it. So in simple terms, y-intercept is nothing but the y-coordinate of the point where the graph intersects the y-axis. So, in the above case y-coordinate will be -2.
Now, moving on we can also say that when x = -1 the value of y is equal to 0. Another way of saying this is at x = -1, f(x) = 0. Take another point for example when x = -2, then value of y = 2, hence we can conclude that at x= -2, f(x) = 2. So, in short to conclude the value of function is represented on the y-axis.
Watch the below video in order to have more in-depth understanding of graphs of functions and more importantly shifting of graphs.


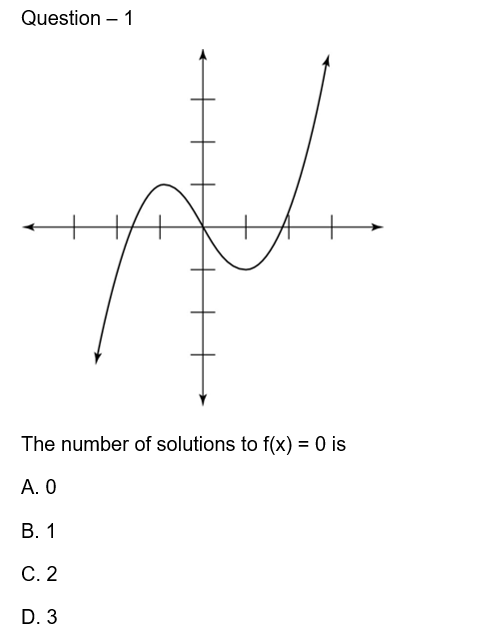
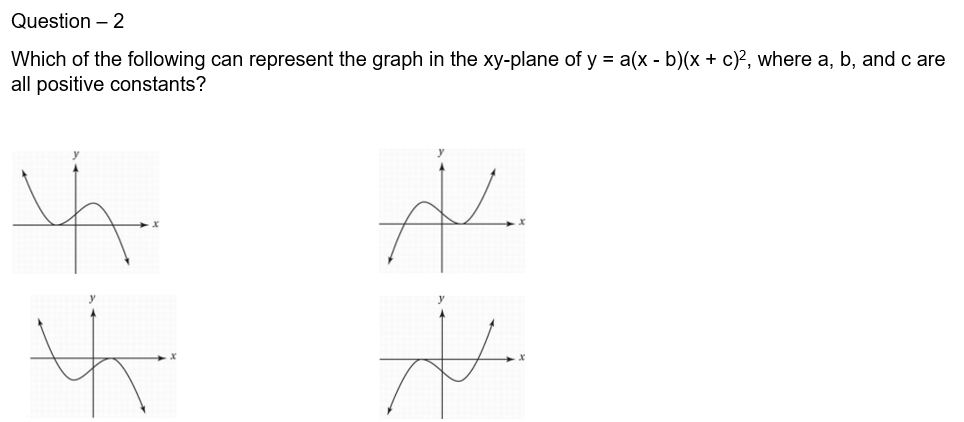
Try the below questions once you have gone through the above video;